Personal
In 2025, I decided to make one visualization of something relevant to my personal life per month to hone my design skills and be creative with my skillset. These designs take the form of blog posts, where I have text interlaced with visualizations and images, and they tend to be more creative and artistic. I often spend time on the bus or while I'm in other in-between states thinking about ideas for what to visualize each month and ideating on the design, but I complete the dataset collection/curation and the implementation in one day of work.
Clues by Mara
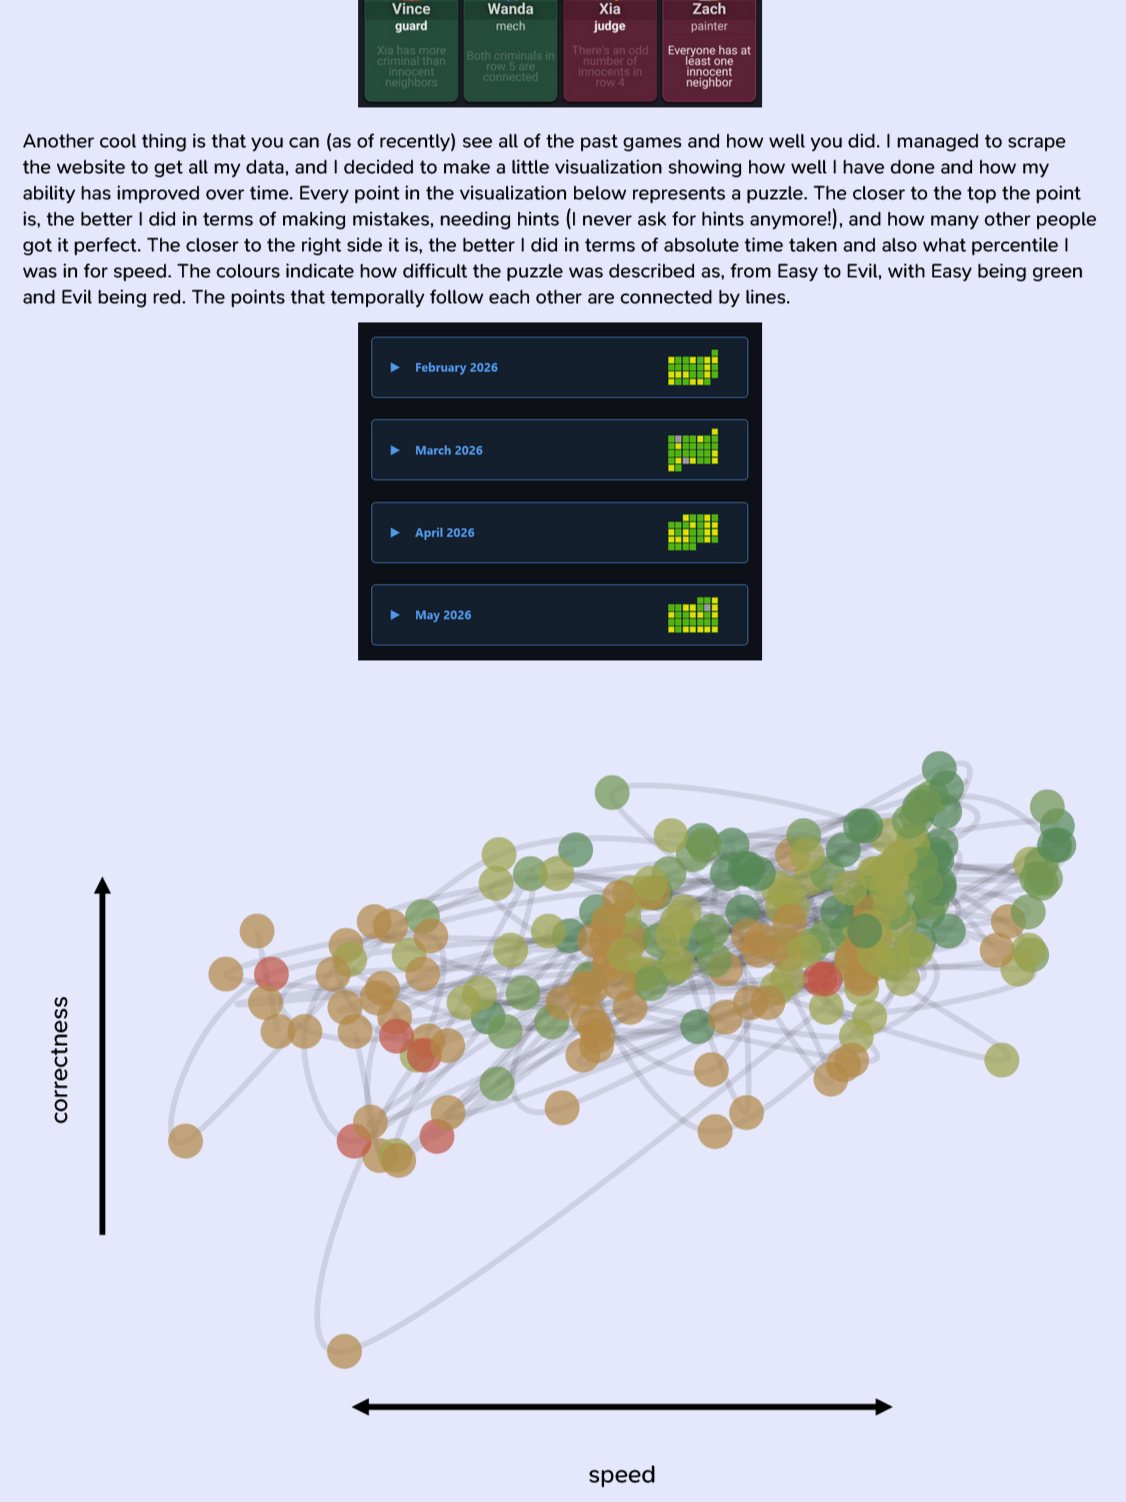
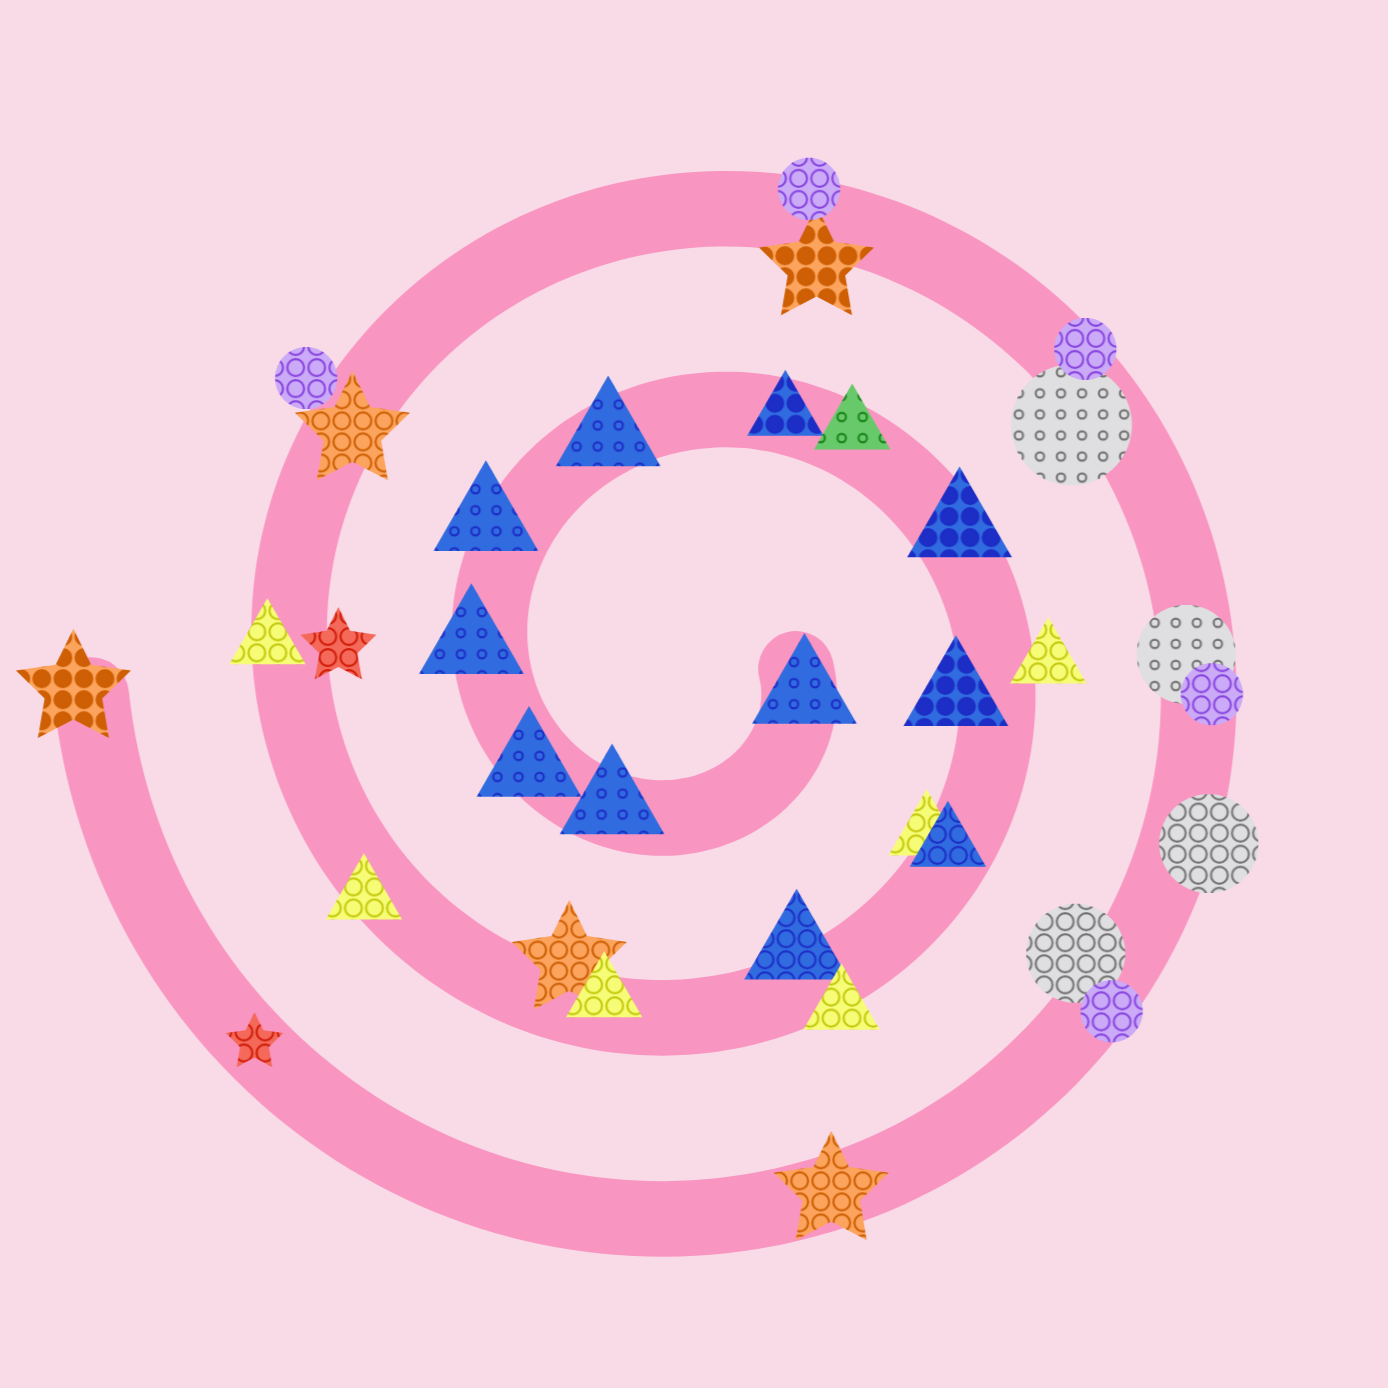
A visualization of my favourite daily puzzle called Clues by Sam!
Check out the page here and the open-source repository here!
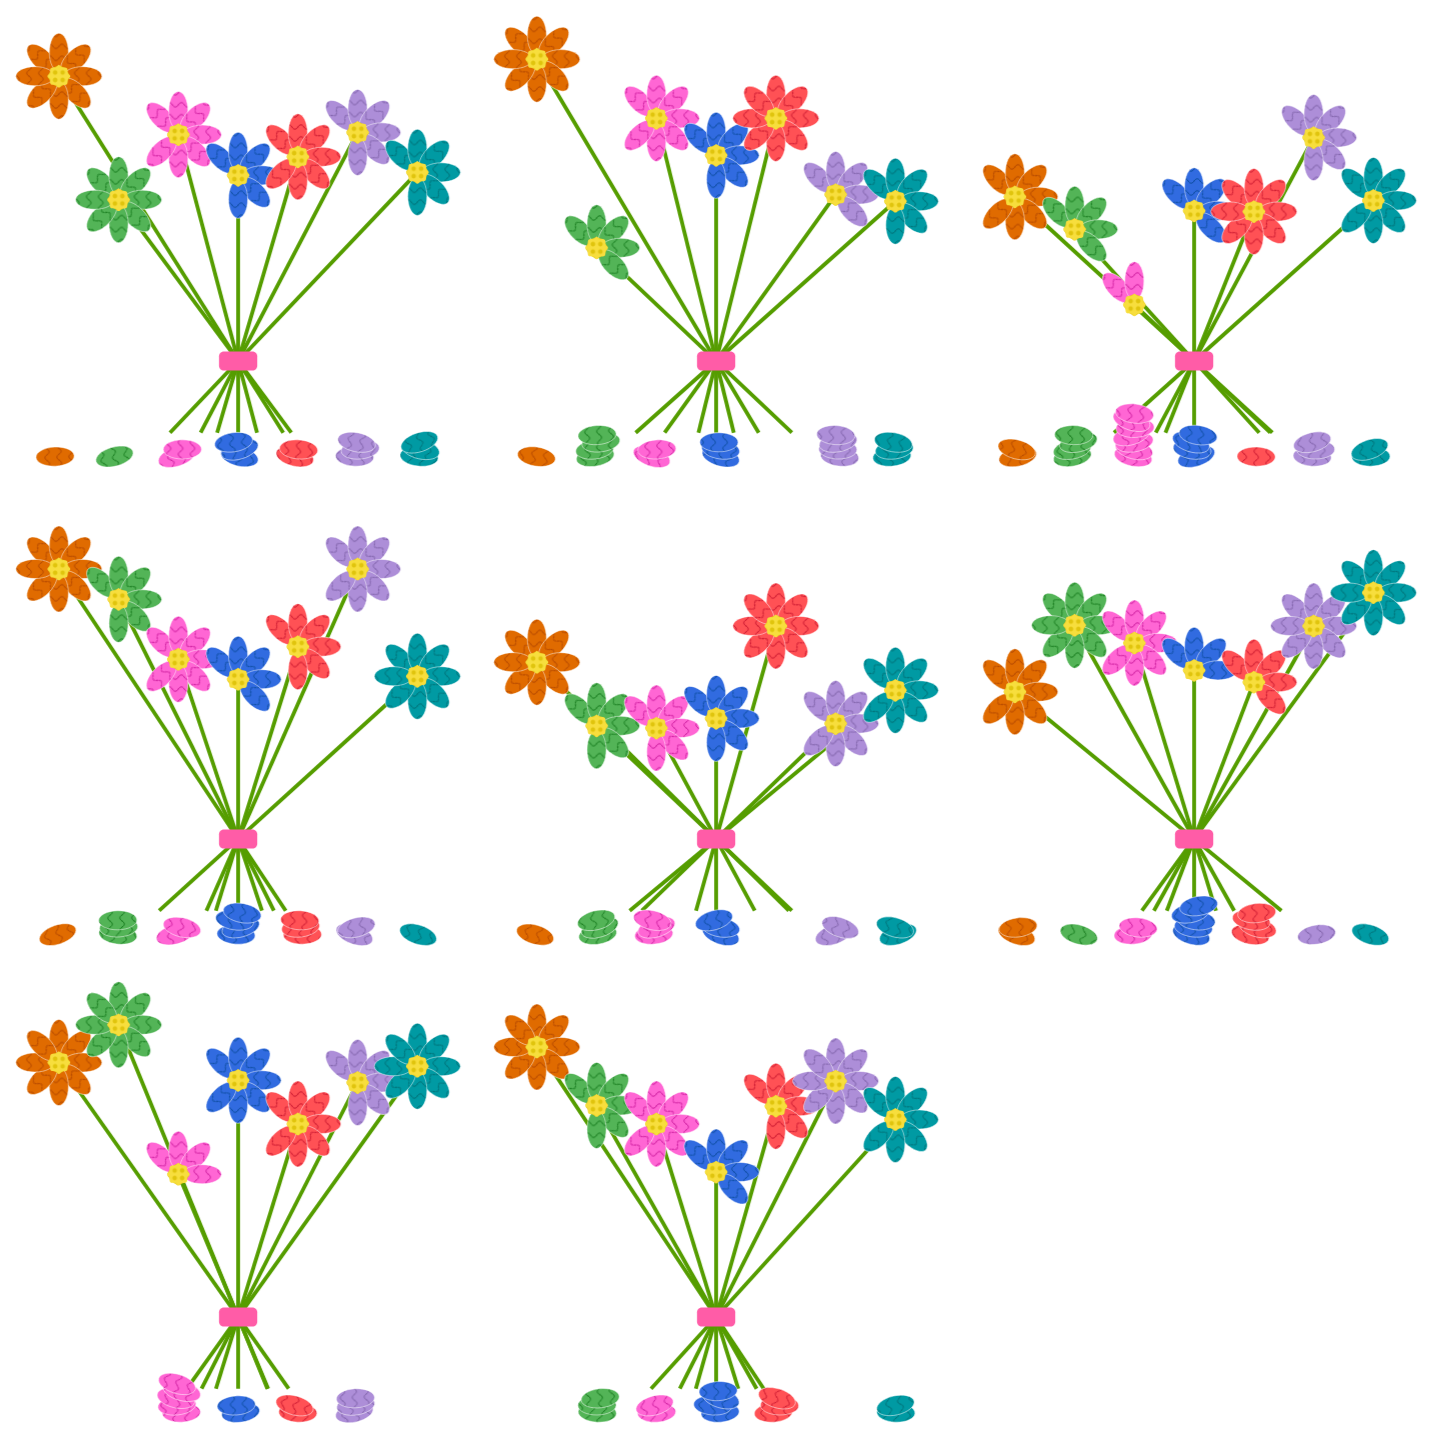
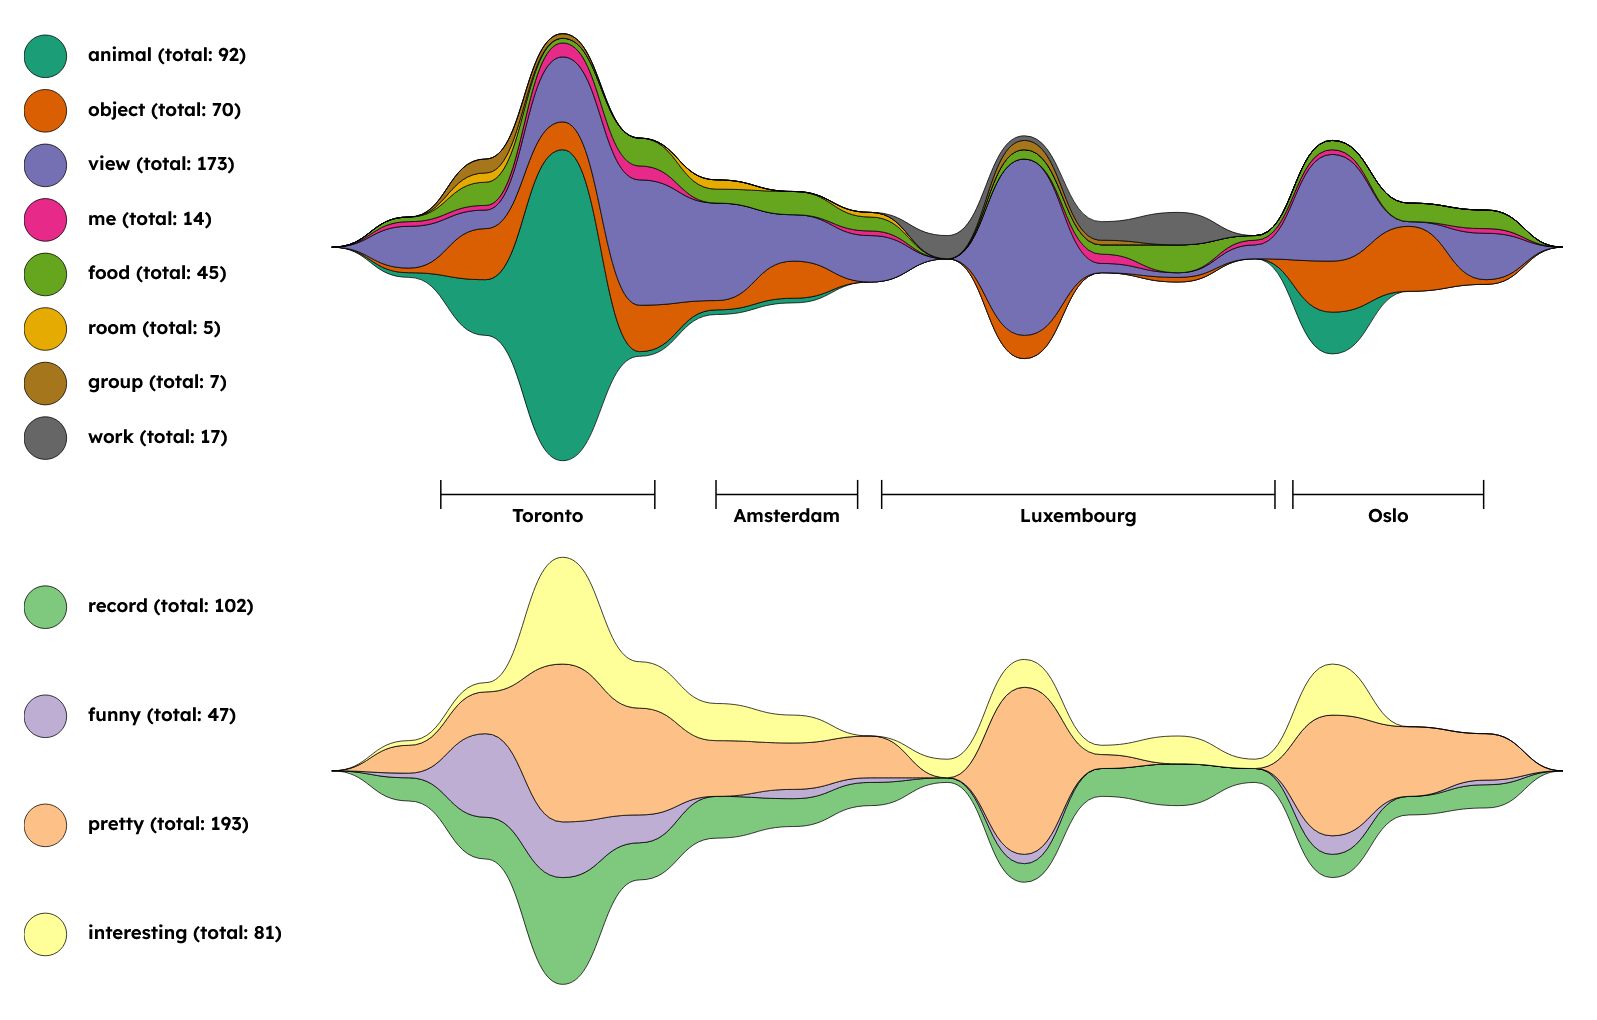
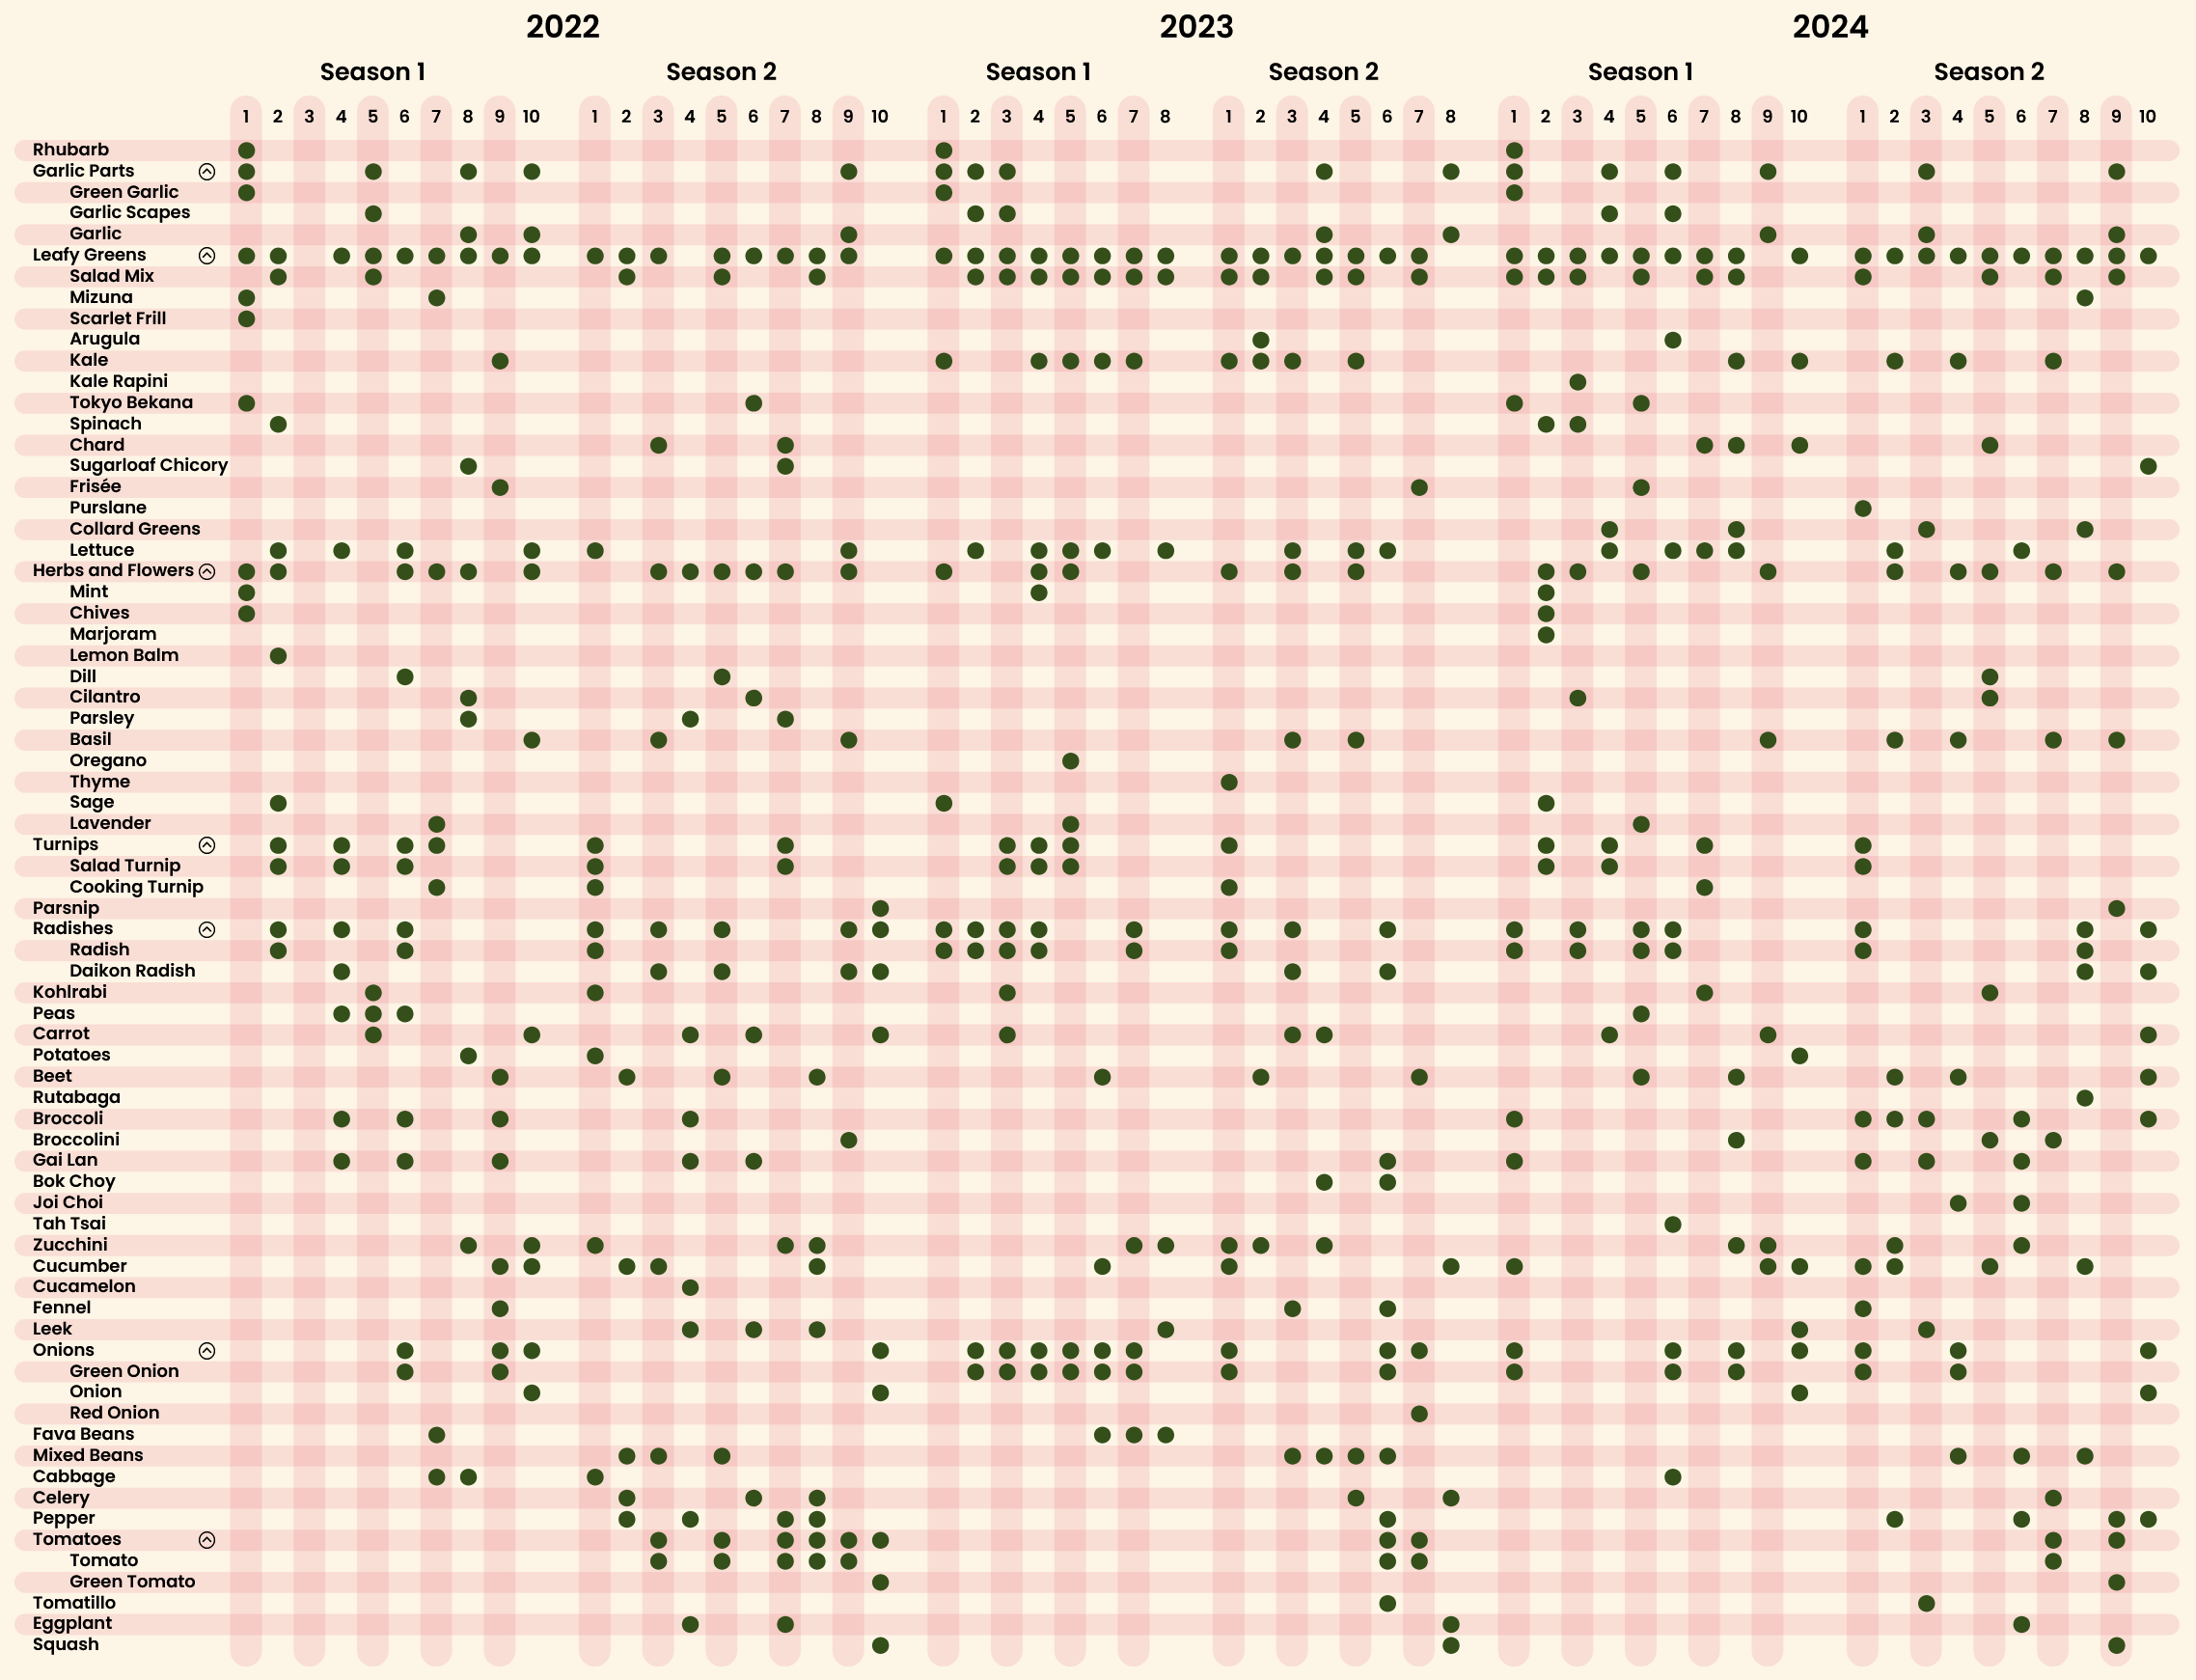
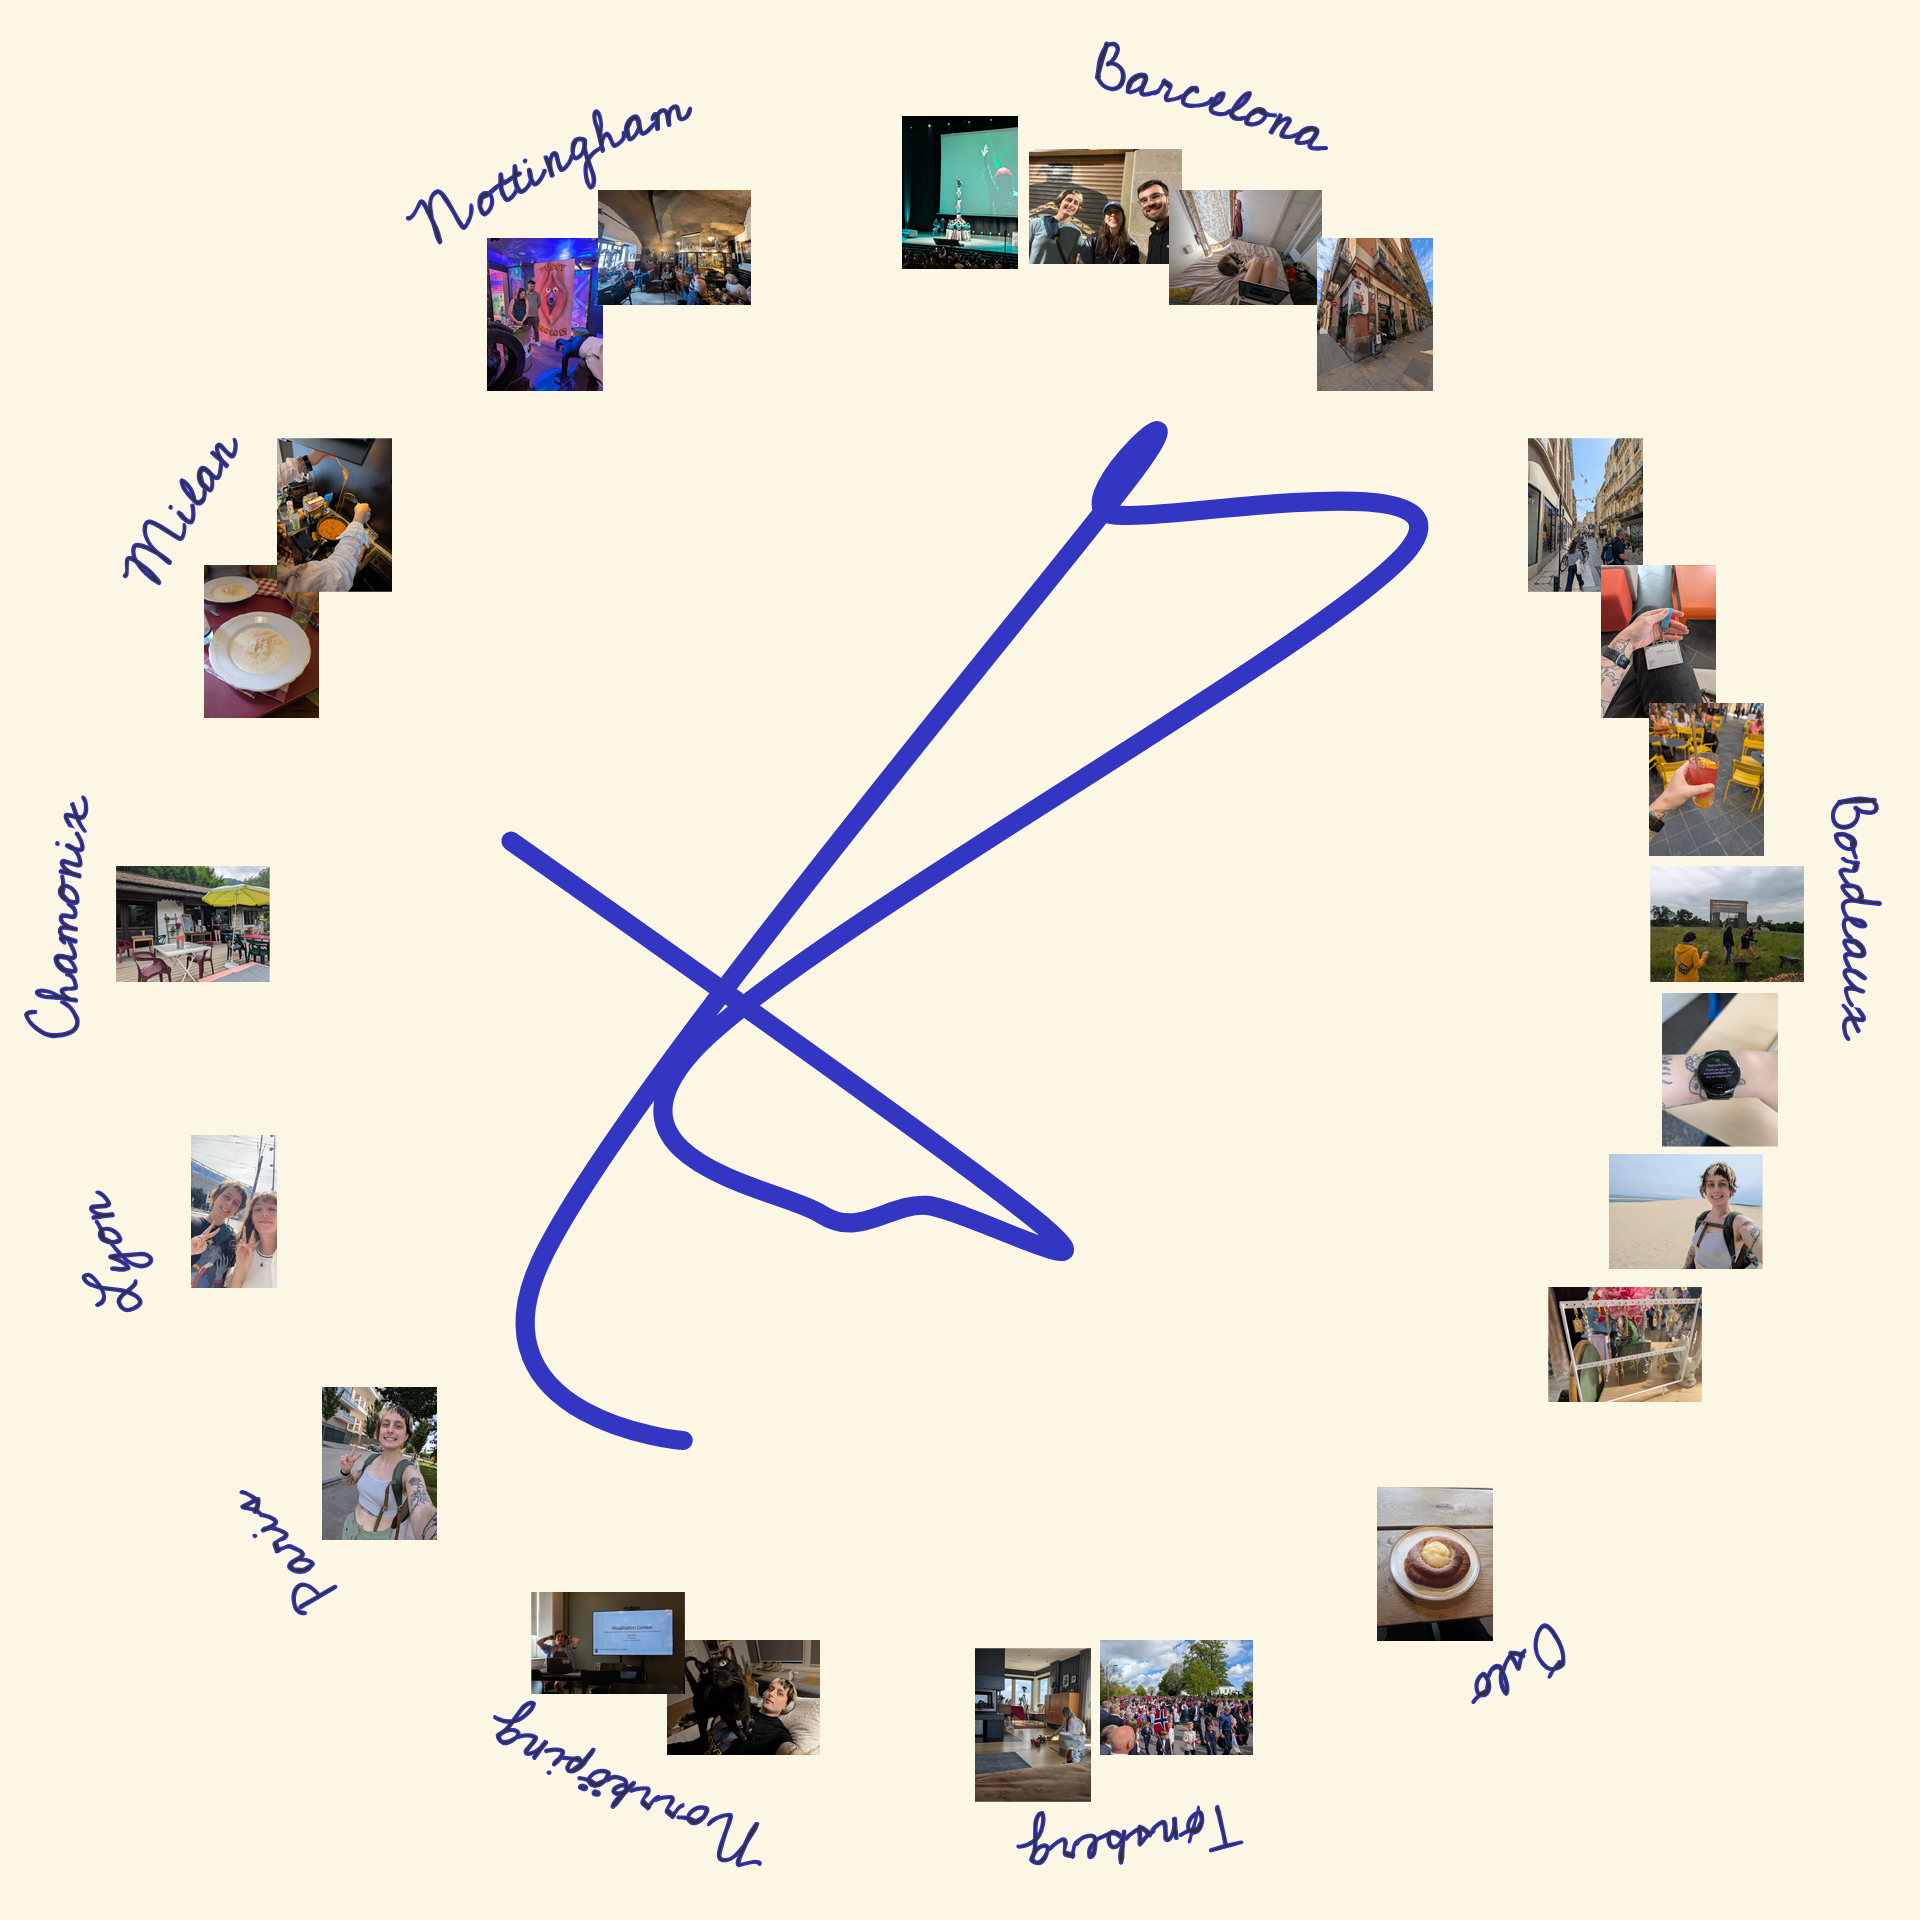
Community Care Harvest Box
As part of more personal reflection on my time living in Vancouver, I made a visualization of the vegetables I've received from the Collingwood Neighbourhood House x Fresh Roots Community Care Harvest Box between 2022 and 2024.
Check out the page here and the open-source repository here!
Academic
Visualizations I have designed for research and courses.
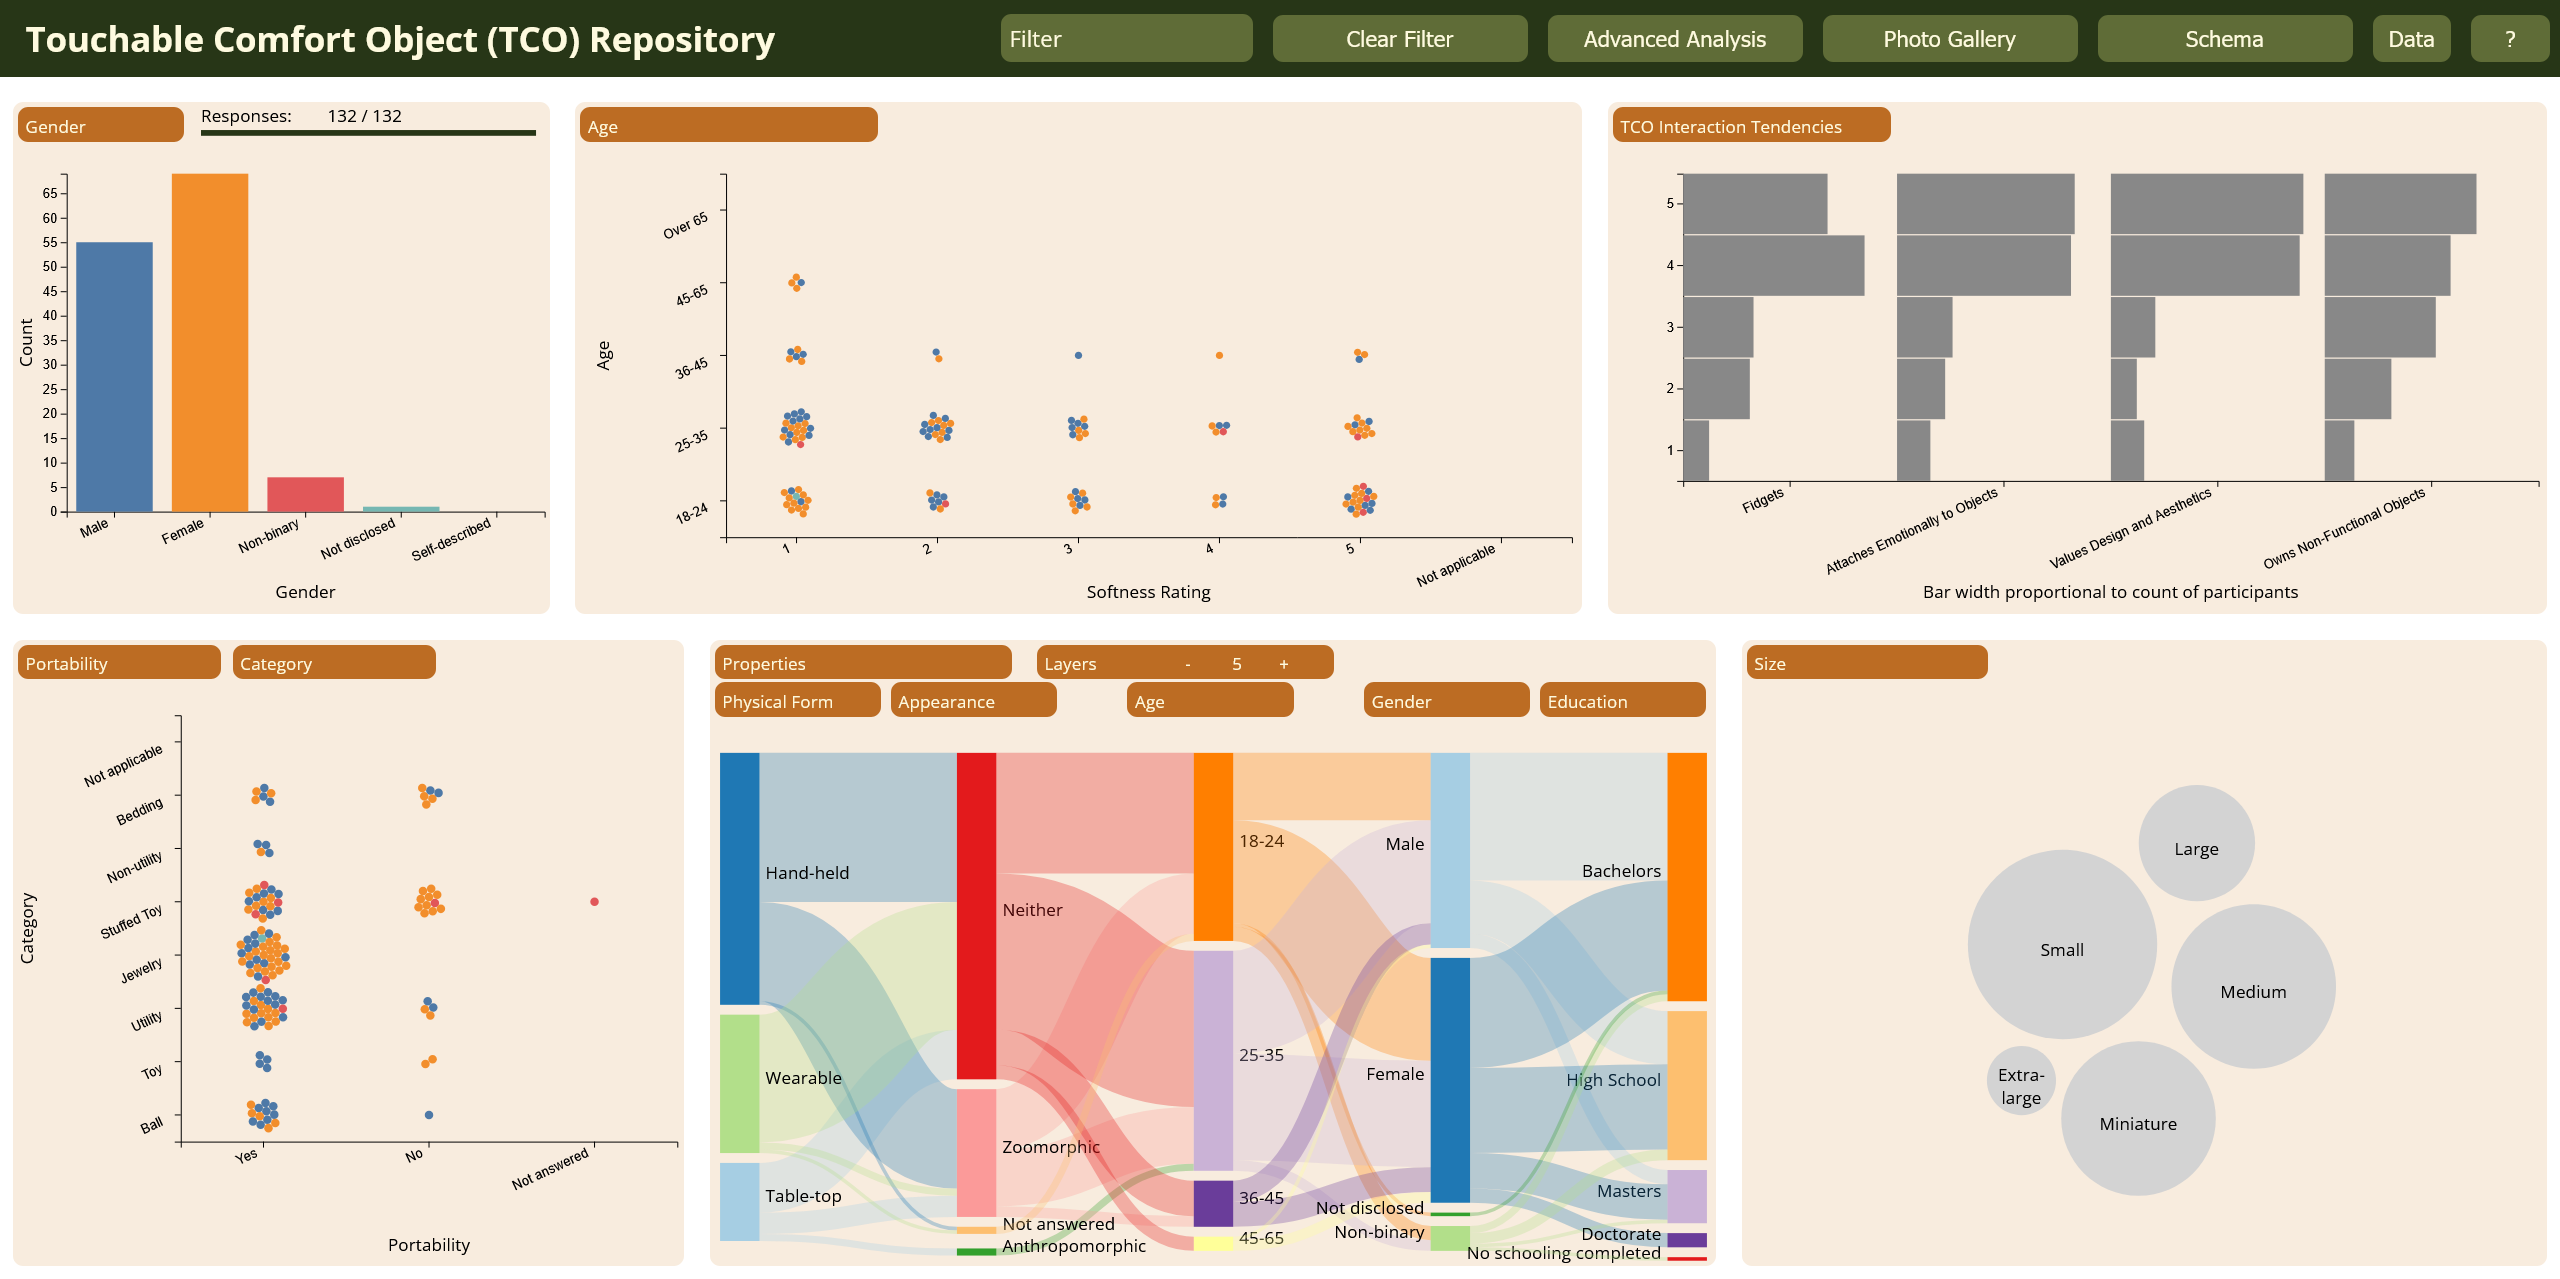
Touchable Comfort Object (TCO) Repository Dashboard
Designers: Preeti Vyas, Bereket Guta, Angel Bao, Rúbia Reis Guerra, Mara Solen, Noor Naila Imtinan Himam, Andero Uusberg, Karon E MacLean
This dashboard enables exploration of the TCO repository. The main authors designed the original dashboard and I provided design feedback and implemented it.
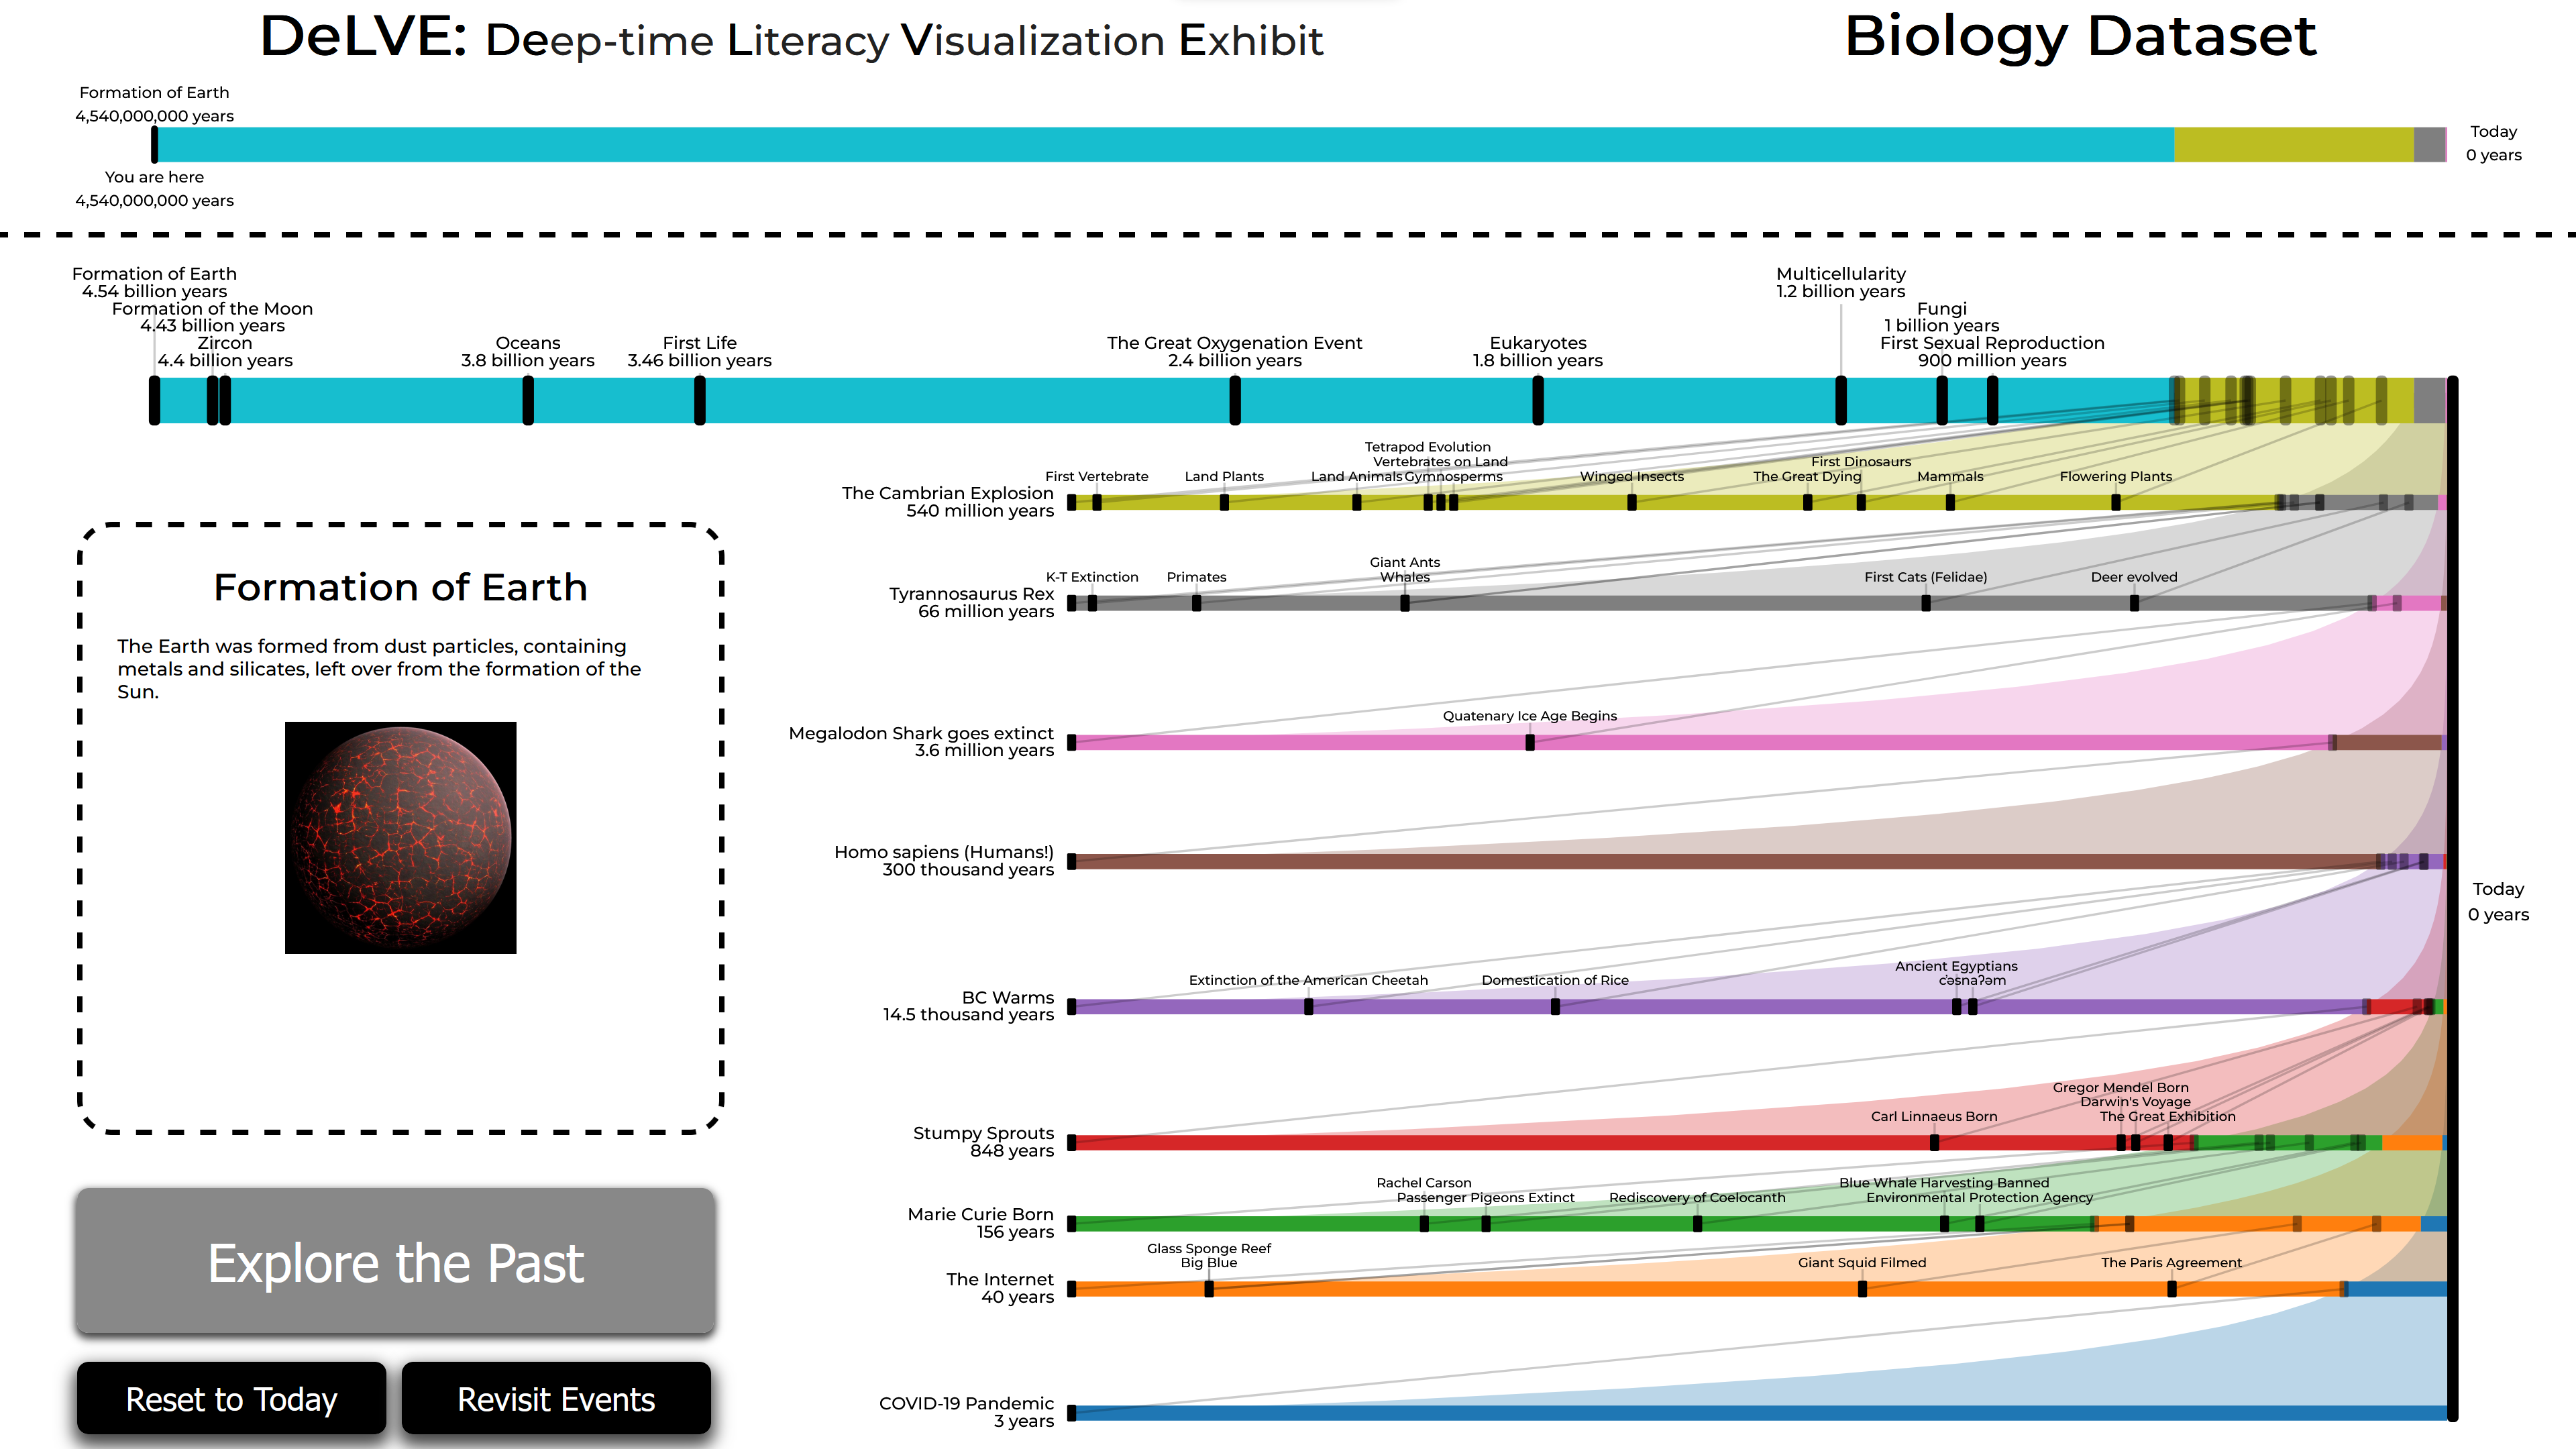
DeLVE: Deep-time Literacy Visualization Exhibit
Designers: Mara Solen, Nigar Sultana, Laura Lukes, Tamara Munzner
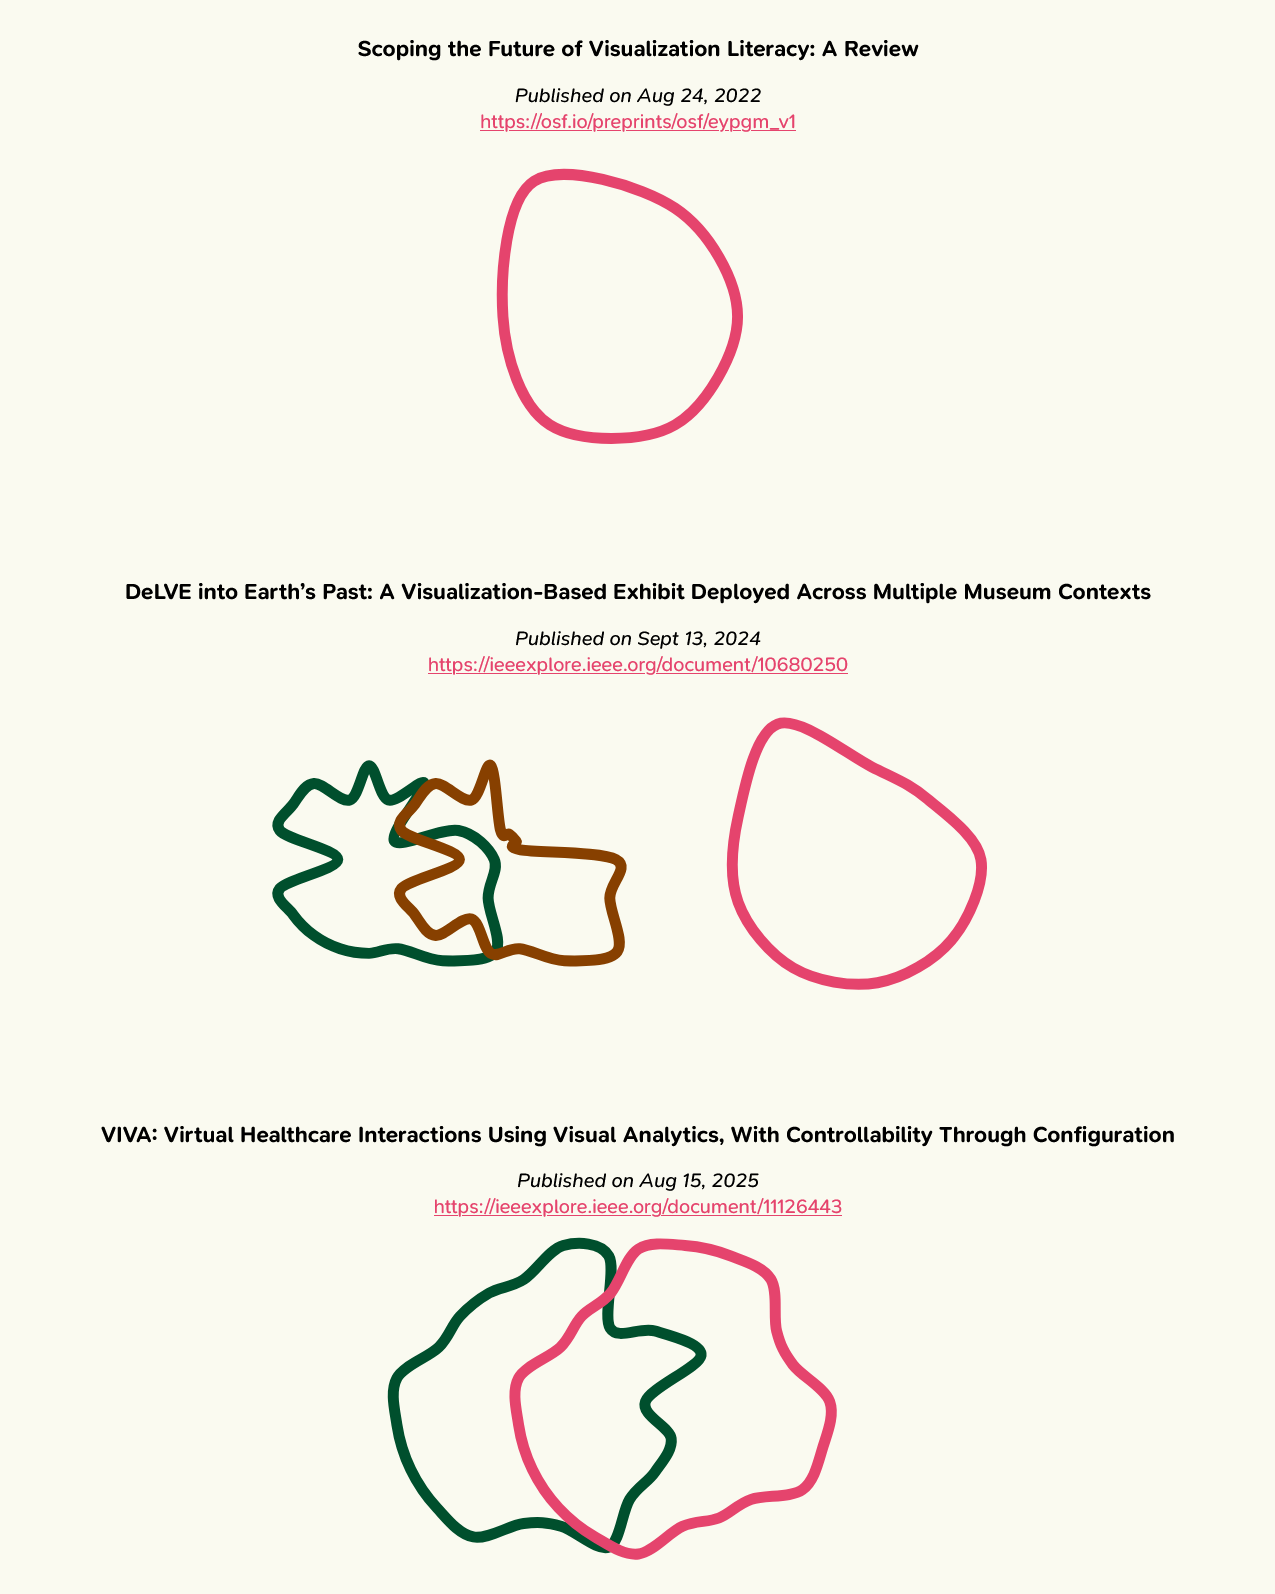
DeLVE is a visualization system designed for use as a museum exhibit. It visualizes data from past events on different scales with the intention of helping museum visitors improve their proportional reasoning skills.
See the live demo here, the open-source repository here, and the associated paper here!
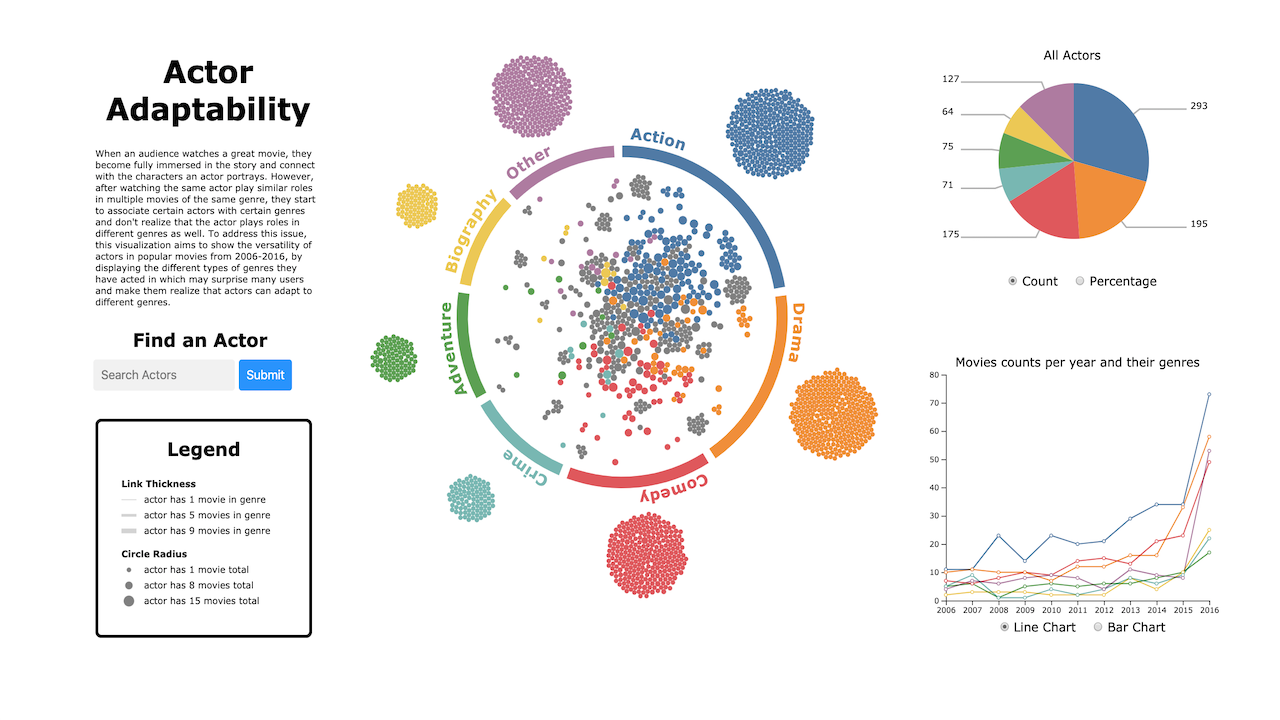
Actor Adaptability
Designers: Mara Solen, Ethan Tam, Ian Del Rio
Actor Adaptability is a visualization that showcases actors' flexibility and ability to act in multiple genres using data from the top 1000 movies of the last decade. The main view is a network diagram that shows all the actors of the dataset and the genres they tend to act in. Viewers can use this to see how actors compare against each other in the number of movies and diversity of genres they have been in.
See the live demo here!
Non-Visualization
Websites I have designed and implemented that don't include data visualizations.

UBC InfoVis Group Website
Designers: Mara Solen + all past web tzars!
I converted the old website to Jekyll and updated the stylings.
See the website here!

This Website
Designer: Mara Solen
I like drawing aesthetic design inspiration from nature. The colours for this website were sampled from the photo below.
See the website source on GitHub!